Wednesday, February 29, 2012

Survey 6 Posted

PHC Surveyor Episode 6: Spring Break
Spring break is almost here, just now barely out of reach,
Despite midterm season fear, still I thee humbly now beseech,
That relaxed from wearied labor, you take short repose this day,
To stop working on your paper, and instead take this survey :)
(Yes, I am a corruptor of the youth :-/)

Thursday, February 23, 2012

Survey 5 Results

PHC Surveyor officially passed the 150 participants threshold this week :) Thank you everyone for participating!

Also, to the few alumni who take the survey (we've been getting about 3-5 each week), I apologize for my mistake this week on the demographic data. I didn't realize that it hadn't added the "Alumnus" option until it was too late, and by the time I added it in, apparently y'all had voted. My apologies. :-/

Without further ado, here are the conclusions and results :)

Conclusions

  • Dr. Spinney wins the Presidential election by way of the freshmen vote.
    • If you split out results by class, Spinney, Farris, and Mitchell take first, second, and third respectively among the underclassmen. Haynes, Kucks, and Russell take first/second/third among upperclassmen.
    • Kinda puts a new spin on political "class warfare" doesn't it? ;)
  • Bets on Tyler Stockton in a wrestling match. Bets on our amazing Marines if anyone dares try to mess with our campus.
  • We like tradition :) Half of the student body prefer chicken tenders on Friday lunch.
    • Not surprisingly, freshmen are more willing to have chicken tenders anytime once a week, while seniors are the most likely to be Friday lunch purists. 
    • People who would rather not have chicken tenders maintain steady representation each class.
  • More than half of students expect to be married by age 23-25. (Assuming college years to be 18-22, that puts marriage out at 2-3 years after graduation for most people.)
    • 90% of campus expects to be married by age 27.
    • Guys who rated the attractiveness girls at PHC a '7' or higher are 15% more likely to expect to be married by age 25, than guys who rated attractiveness at '6' or less. Correlation? A distinct possibility.
    • People who are Friday Lunch Purists for chicken tenders are 10% more likely to believe they will be married by age 25 than people who are willing to eat chicken tenders anytime once a week. They are also 25% more likely to believe they will be married by age 25 than people who want chicken tenders less than once a week. Correlation? Hmm...(Liking chicken tenders apparently raises your expectation of a younger marriage age) ;)
  • Dr. Montgomery is scary. PBR wins as "most intimidating class" by more than 30% over Con Law in second place.
  • PHC students start the week on Monday. That's why we call it a weekend.
  • Similar to the guys, most girls have their eye on about 2-3 guys. Ten percent have no interest in any of the guys at PHC whatsoever. (Man, that's depressing.)
  • About 45% of students had danced some before coming to PHC. 
    • Girls were 5% more likely to have never danced at all than guys, but also 7% more likely to have danced significantly before coming to PHC.
    • Guys are 6% more likely to say "I don't dance" than girls :-P C'mon guys :-P
  • PHC girls are pretty good looking. The average attractiveness rating of PHC girls is 6.77 ± 0.38 (Assuming normalized distribution at 90% confidence level.) The median rating was '7' and the most selected rating (mode) was '8'. (8 guys choose not to participate in this question.)
  • Nearly half the students want more dorms as the next building project. Nearly a quarter would like a student kitchen.
    • Notable "others" include a library building, a performing arts center, and an "Interactive Founding Fathers Exhibit."

Enjoy the results!

Survey 5 Results

Dr. Walker – 4.6% (7)
Dr. Farris – 14.6% (22)
Dr. Haynes – 13.2% (20)
Dr. Mitchell – 14.6% (22)
Dr. Guliuzza – 7.9% (12)
Dr. Kucks – 10.6% (16)
Professor Russell – 9.3% (14)
Dr. Spinney – 19.9% (30)
Dr. Chodakiewicz – 2.0% (3)
Dr. Cox – 1.3% (2)
Other – 2.0% (3)

Martyn Evans – 37.1% (56)
Tyler Stockton – 62.9% (95)

Friday lunch purist – 49.7% (75)
Anytime once a week – 37.1% (56)
I’d rather have them less than once a week – 13.2% (20)

Under 20 – 0.7% (1)
20-22 – 21.2% (32)
23-25 – 52.3% (79)
26-27 – 19.2% (29)
28-29 – 2.6% (4)
Thirty or over – 4.0% (6)

Physics –10.6% (16)
Biology – 13.2% (20)
PBR – 44.4% (67)
Constitutional Law – 13.9% (21)
Economics for the Citizen – 2.0% (3)
Internship – 9.3% (14)
US History – 2.0% (3)
Other – 4.6% (7)

Sunday – 23.2% (35)
Monday – 76.8% (116)

None – 10.9% (7)
1 – 9.4% (6)
2-3 – 40.6% (26)
4-5 – 15.6% (10)
6+ – 1.6% (1)
I am in a relationship – 21.9% (14)

I am a dancer/had numerous lessons before PHC – 14.6% (22)
I danced some before PHC – 46.4% (70)
I had never danced before coming to PHC – 32.5% (49)
I don’t dance – 6.6% (10)

n: 79
Mean: 6.77 ± 0.38 (90% Confidence)
Standard Deviation: 2.03
Median: 7
Mode: 8
Dorm(s) – 47.0% (71)
Student Kitchen – 22.5% (34)
Classroom(s) –1.3% (2)
Drinking Fountains for D1-D4 – 6.6% (10)
Chapel – 9.3% (14)
Rifle Range :-P – 7.3% (11)
Football Field/Stadium – 2.0% (3)
Other – 4.0% (6)

Demographic Information:

Total Participants in Survey: 151           
Participants in Demographic data: 99% (150)
  • Male: 57% (86)
  • Female: 43% (64)
  • Freshman: 27% (41)
  • Sophomore: 27% (40)
  • Junior: 28% (42)
  • Senior: 16% (26)
Other results distributed by demographic:


Results of "Expected Marriage Age" by other factors:


Thursday, February 16, 2012

Survey 4 Results

We had record participation in this week's survey. Thank you everyone for participating!

(And for those of you who are ballot stuffing...please don't. It takes me quite a bit of time to sort out the read responses from the prank responses, and I'd rather not spend my morning doing that :-P)

Conclusions:

  • Dr. Tallmon's hit song "Ode To the Virtuous Rhetor" sold 5.2 million copies in the year 2024. Notable covers include Aaron Strassner's hip hop version that was #1 on the charts for 6 months.
  • Campus is divided on the dining hall scanner. Guys like it rather more, girls like it rather less.
  • Mr. Hall is Captain BatHulk.
  • In general, PHC students do pretty well reading what we are assigned. The rumors are true, however, that freshmen read more and seniors...well, "triage". ;)
  • PHC students are more likely to read because the text is interesting and we are pledged by honor to do so. We are less likely to read if quizzes/worksheets are the only incentive.
  • Most guys that aren't in relationships have 2-3 girls they are trying to decide with whom to initiate. :-P
  • Big surprise: Most students call home several times a week or several times a month.
    • Actually, I was rather surprised that this holds pretty true with no real distinguishable differences across gender and class. We are pretty consistent.
  • Overall, we want a Fall break, not an Election break.
  • Forty-five percent of girls would go on a blind date with a PHC guy. Fifty-five would not.
    • Interestingly, Juniors and Seniors are much more likely to be willing to go on a blind date (~65%) than Freshmen and Sophomores (~35%)
    • I personally find it interesting that the 45-55 split matches nearly exactly with the guy's question last week whether girls give guys a chance. (But that's just me.)
    • I also find it interesting that more than 8 guys answered the "Girl's Only" question. Most of them answered "Yes." Still not sure whether they just weren't paying attention or they were trying to boost numbers. (For the record, I removed guy answers to the question.)
  • I don't care what you all say, but I still think bowties are cool. Sixty percent of girls think they are nerdy though :-P
:) Enjoy the results!


Survey 4 Results:
Dr. Hake – 3.4% (5)
Dr. Tallmon – 50.3% (74)
Dr. Cox – 8.8% (13)
Dr. Tanner – 5.4% (8)
Dr. Guliuzza –13.6% (20)
Professor Russell – 3.4% (5)
Dr. Mitchell – 2.7% (4)
Dr. Favelo – 2.7% (4)
Dr. Haynes – 8.8% (13)

Like – 51.7% (76)
Dislike – 48.3% (71)

Batman – 26.5% (39)
Superman – 6.1% (9)
Spiderman – 4.1% (6)
The Hulk – 25.9% (38)
Ironman – 14.3% (21)
Captain America – 23.1% (34)

*Alumni, there were only five of you, so I didn't feel there was enough data to have a separate graph for you, but just FYI, 60% of the alums said "The Hulk," 20% say "Batman," and 20% say "Captain America."

0%-20% – 2.0% (3)
20%-40% – 10.9% (16)
40%-60% – 25.9% (38)
60%-80% – 23.8% (35)
80%-100% – 37.4% (55)

Quizzes – 19.0% (28)
Reading reports/worksheets – 17.0% (25)
Signing pledge in class of how much of the reading I did – 30.6% (45)
Assign reading that interests me – 33.3% (49)

None – 8.2% (7)
1 – 9.4% (8)
2-3 – 34.1% (29)
4-5 – 9.4% (8)
6+ – 10.6% (9)
I am in a relationship – 28.2% (24)

Several times a day – 9.5% (14)
Several times a week – 40.8% (60)
Several times a month – 42.2% (62)
About once a month – 5.4% (8)
Less than once a month – 2.0% (3)

Later (Election br...I mean “Fall” break) – 29.9% (44)
Earlier (Octoberish, midway through the semester) – 70.1% (103)

Yes – 45.0% (27)
No – 55.0% (33)

Awesome! – 25.2% (37)
Nerdy :P – 46.3% (68)
Bowties are cool” – 28.6% (42)

Demographic Information

Total Participants in Survey: 147           
Participants in Demographic data: 99% (146)
  • Male: 59% (86)
  • Female: 41% (60)
  • Freshman: 27% (40)
  • Sophomore: 21% (31)
  • Junior: 33% (48)
  • Senior: 14% (21)
  • Alumnus: 3% (5)
Other results distributed by demographic:


Tuesday, February 14, 2012

Survey 4 Posted

Survey 4 up: http://kwiksurveys.com?s=LJDKNO_3b3bb89d

10 questions
3 minutes
1 survey

You know the drill :) Come back Thursday for the results.

Enjoy!

Thursday, February 9, 2012

Survey 3 Results

Thanks everyone! Sorry about the delay in getting this out. Here are the results from Survey 3.

Conclusions:
  • Josiah and Lacy are pretty cute.
  • Dr. Chodakiewicz knows a lot more about everything than you do.
  • PHC should have a bagpipe concert :-P
  • Red Hill > Oak Hill (sorry guys, I'm a D5er...I can't help it).
    • Interestingly, D5 (which has more guys) beat D4 (with fewer guys) in the overall poll, but among the PHC women, the split is exactly 50-50.
  • If you don't like the new Herald style...you  might be an upper classman.
    • Overall, campus likes the new Herald style, but Freshmen and Sophomores are much more likely to approve than Juniors and Seniors.
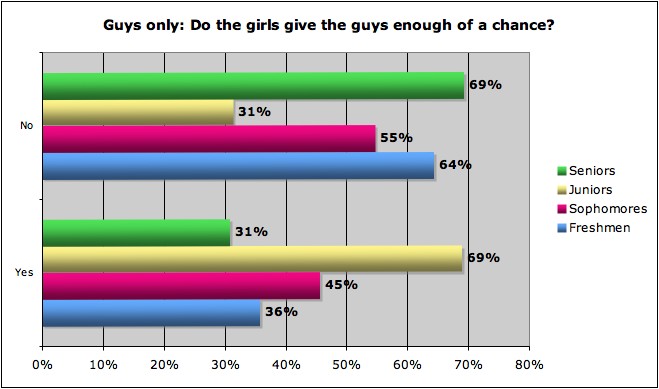
  • Guys should initiate more (but Freshmen girls are the most likely to give you some grace).
  • The Dining Hall is the best place to socialize on campus.
    • After that, girls are more likely to socialize off-campus or in the coffee shop. Guys are more likely to hang out in the dorm rooms.
    • Seniors like socializing off campus. Juniors like the coffee shop.
    • The student lounge ain't exactly the social spot on campus.
  • The Juniors think girls give guys a chance. Everyone else says no.
  • PHC values quality food.
Comments? Complaints? Suggestions for future questions? Feel free to email me/leave a comment.

Survey 3 Results

Name the cutest couple (Top Three Results):

1. Josiah and Lacy
2. Nick and Sarah
3. Ben and Chelsea

Cute/Clever/Creative Couples
Dr. and Mrs. Haynes
James Nelson and Jordan Sillars
Chicken Tenders and Macaroni

Dr. Aikman – 19.3% (22)
Dr. Spinney – 26.3% (30)
Dr. Guliuzza – 10.5% (12)
Prof. Russell – 9.6% (11)
Dr. Chodakiewicz – 31.6% (36)
Col. Middleton – 2.6% (3)
Bryant Condrey – 36.8% (42)
Jonathan Chambers – 63.2% (72)
PHC Men's Soccer – 30.8% (211pts)
PHC Women's Soccer – 30.3% (207pts)
PHC Men's Basketball – 30.7% (210pts)
PHC Women's Basketball – 8.2% (56pts)


*Calculated by assigning points for ranks. A first ranking is worth 3 points, second is worth 2 points, third is worth 1 point, and zero points for fourth.


D4 – 37.7% (43)
D5 – 62.3% (71)

Yes – 71.9% (82)
No – 28.1% (32)
Yes – 25.5% (14)
No – 74.5% (41)
Dorm Rooms – 14.0% (16)
Dorm Lounges – 8.8% (10)
Dining Hall – 39.5% (45)
Off-campus – 17.5% (20)
Coffee Shop ­– 15.8% (18)
Student Lounge – 0.9% (1)
Outside (on-campus) – 3.5% (4)
Yes – 45.6% (26)
No – 54.4% (31)
Lower cost – 21.9% (25)
Higher quality (food quality and/or # of choices) – 44.7% (51)
More flexibility for non-cafeteria options – 33.3% (38)

Demographic Information: 
Total Participants in Survey: 114 
Participants in demographic data: 96% (110)

  • Male: 51% (56)
  • Female: 49% (54)
  • Freshman: 25% (27)
  • Sophomore: 25% (27)
  • Junior: 30% (33)
  • Senior: 18% (20)
  • Alumnus: 2% (2) 


Other results distributed by demographic:


Tuesday, February 7, 2012

Wednesday, February 1, 2012

Survey 2 Results

Thanks all who participated! Here are the results from Survey 2.

Conclusions:
  • Campus misses "PHC Security."
  • Girls would rather see Dr. Farris debate Obama. Guys would rather see him debate Ron Paul.
  • Nine guys don't realize that girls on campus wear makeup.
  • Soft Serve Ice Cream would be really nice.
  • One-third of campus hits the snooze button first.
    • Seniors are 20% more likely to hit the snooze button first.
    • Girls are 10% more likely to hit the snooze button first and 15% more likely to go to breakfast first.
    • Guys are 10% more likely to take a shower first and 20% more likely to run to class first.
  • Thirty percent of campus believes they have a "0%-20%" chance of finding their future spouse at PHC.
    • Sixty percent of women believe they have EITHER a "0%-20%" chance OR a "80%-100%" chance.
    • Seventy percent of men believe they have less than a 50% chance of finding a spouse at PHC.
  • Only 20% of PHC students serve at a local church.
  • Honey mustard sauce es el mejor.
  • Student government lives to fight another day.
  • Congratulations PHC. We aren't a video game crazed school. ;)
Questions? Comments? Complaints? Suggestions? Leave a note. :)

Survey 2 Results
PHC Security: 96% (98)
PHC Campus Safety: 4% (4)
 
Dr. Farris vs. Obama: 44% (45)
Dr. Farris vs. Ron Paul: 56% (57)

Yes: 20% (14)
No: 67% (47)
They wear makeup?? 0.o: 13% (9)

Panini maker: 14% (14)
Soft serve ice cream: 42% (43)
Toaster oven (that can toast cheese on the bread): 17% (17)
Smoothie blender: 25% (26)
Student use dishwashing station/sink: 2% (2)

Hit the snooze button: 36% (37)
Exercise/Stretch: 7% (7)
Prayer/Devotions: 9% (9)
Take a shower: 21% (21)
Go to breakfast: 15% (15)
Run to class: 13% (13)

0%-20%: 29% (30)
20%-40%: 18% (18)
40%-50%: 18% (18)
50%-60%: 9% (9)
Some sleep-deprived survey writer forgot to add the 60%-70% option :-P
70%-80%: 11% (11)
80%-100%: 16% (16)

Yes: 22% (22)
No: 78% (80)

Honey Mustard Sauce: 32% (33)
Barbeque Sauce: 9% (9)
Spicy Sauce: 7% (7)
Ranch Sauce: 13% (13)
No Sauce: 10% (10)
I don’t eat Chicken Tenders: 12% (12)
Other: 18% (18)
 Most popular "Other" choices were Ranch+Spicy Mix and Ketchup.

Yes: 10% (10)
No: 67% (68)
Don’t care either way: 24% (24)

Modern Warfare 3: 18% (18)
Black Ops: 14% (14)
Call of what?: 25% (26)
Video games :-P:  43% (44)
Demographic Information:
Total Participants in Survey: 102
Participants in demographic data: 86% (88)
  • Male: 58% (51)
  • Female: 41% (36)
  • Freshman: 31% (27)
  • Sophomore: 19% (17)
  • Junior: 28% (25)
  • Senior: 18% (16)
  • Alumnus: 3% (3) 

Other results distributed by demographic: