Conclusions:
- Josiah and Lacy are pretty cute.
- Dr. Chodakiewicz knows a lot more about everything than you do.
- PHC should have a bagpipe concert :-P
- Red Hill > Oak Hill (sorry guys, I'm a D5er...I can't help it).
- Interestingly, D5 (which has more guys) beat D4 (with fewer guys) in the overall poll, but among the PHC women, the split is exactly 50-50.
- If you don't like the new Herald style...you might be an upper classman.
- Overall, campus likes the new Herald style, but Freshmen and Sophomores are much more likely to approve than Juniors and Seniors.
- Guys should initiate more (but Freshmen girls are the most likely to give you some grace).
- The Dining Hall is the best place to socialize on campus.
- After that, girls are more likely to socialize off-campus or in the coffee shop. Guys are more likely to hang out in the dorm rooms.
- Seniors like socializing off campus. Juniors like the coffee shop.
- The student lounge ain't exactly the social spot on campus.
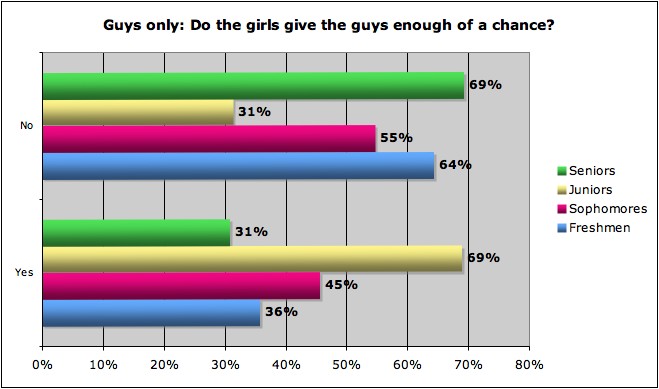
- The Juniors think girls give guys a chance. Everyone else says no.
- PHC values quality food.
Comments? Complaints? Suggestions for future questions? Feel free to email me/leave a comment.
Survey 3 Results
Name the cutest couple (Top Three Results):
1. Josiah and Lacy
2. Nick and Sarah
3. Ben and Chelsea
Cute/Clever/Creative Couples
Dr. and Mrs. Haynes
James Nelson and Jordan Sillars
Chicken Tenders and Macaroni
 |
Dr. Aikman – 19.3% (22)
Dr. Spinney – 26.3% (30)
Dr. Guliuzza – 10.5% (12)
Prof. Russell – 9.6% (11)
Dr. Chodakiewicz – 31.6% (36)
Col. Middleton – 2.6% (3)
|
 |
Bryant Condrey – 36.8% (42)
Jonathan Chambers – 63.2% (72)
|
 |
PHC Men's Soccer – 30.8% (211pts)
PHC Women's Soccer – 30.3% (207pts)
PHC Men's Basketball – 30.7% (210pts)
PHC Women's Basketball – 8.2% (56pts)
|
 |
D4 – 37.7% (43)
D5 – 62.3% (71)
|
 |
Yes – 71.9% (82)
No – 28.1% (32)
|
 |
Yes – 25.5% (14)
No – 74.5% (41)
|
 |
Dorm Rooms – 14.0% (16)
Dorm Lounges – 8.8% (10)
Dining Hall – 39.5% (45)
Off-campus – 17.5% (20)
Coffee Shop – 15.8% (18)
Student Lounge – 0.9% (1)
Outside (on-campus) – 3.5% (4)
|
 |
Yes – 45.6% (26)
No – 54.4% (31)
|
 |
Lower cost – 21.9% (25)
Higher quality (food quality and/or # of choices) – 44.7%
(51)
More flexibility for non-cafeteria options – 33.3% (38)
|
Demographic Information:
Total Participants in Survey: 114
Participants in demographic data: 96% (110)


Total Participants in Survey: 114
Participants in demographic data: 96% (110)
- Male: 51% (56)
- Female: 49% (54)
- Freshman: 25% (27)
- Sophomore: 25% (27)
- Junior: 30% (33)
- Senior: 18% (20)
- Alumnus: 2% (2)
Other results distributed by demographic:


No comments:
Post a Comment