Wednesday, September 26, 2012

Season 2: Episode 3 Results


Highlights:

The Add/Drop Girl Form is split evenly between those who approve, and those who don’t care.  The disapproval rating is down at only 16.5% of the campus.
  • Men are more likely to approve and disapprove of the form.  Women are more likely to not care one way or the other
  • Half of the people who took the survey provided additional comments.  Here are a few notable ones from each side of the debate
    • Disapproving Female: “Even though it is intended to be funny, several girls have actually been treated like this on campus and it's kind of painful and insensitive”
    • Disapproving Male: “No guy should promote something that offends ANY lady (even if it is meant to be funny... if it isn't taken that way, then the joke shouldn't go public).”
    • Ambivalent Male: “There's an add/drop boy form too. Harmless fun.”
    • Ambivalent Female: “I don't find it offensive, it seems more like it is just making fun of how (sometimes badly) relationships are handled on this campus.”
    • Approving Female: “My boyfriend filled out the form as a joke last spring. I thought it was really funny. People make way too big of a deal about it.”
    • Approving Male: “I hope the girls here know that they are fantastic, and that no guy on campus seriously thinks like this.  This form is making fun of both homeschooler relationship ineptitude and stereotypical objectivity.  It's a joke and shouldn't be taken as anything more, and it definitely isn't a good reason to put your friendships in danger”
An overwhelming 90.3% of campus prefers to call the dorms by their real names: D1, D2, D3, D4, and D5.  Less then 10% use the other names.  (Yes, I am biased, and I’m not afraid to show it.)
  • Men are over 3.5 times more likely to use the longer names when referring to the dorms.
  • A few people commented that they use different names depending on context, or on which dorm they are referring to.  Women’s dorms are slightly more likely to be referred to by their number, and men’s by their names.
  • Over a quarter of freshmen prefer the longer names, and the number declines in a consistent curve in the later classes.  This could be caused by two factors: the new students just haven’t learned the proper names yet, or this is a disturbing trend threatening our traditions, and all we hold dear in our conservative worldview.
42.7% of the campus would like to be in a relationship at this time.  This is a reduction by approx. 8 percentage points from when Gregory asked the campus in March last semester.  The percentage of students actually in a relationship has held remarkably steady at 23.3%, which is insignificantly less than in March (23.9%).

Almost 2/3rd of the campus puts on their right shoe first.  This tendency is especially prevalent in females, where almost 3/4 of them place their right shoe on first.
  • To be honest, I have no clue what this says about our campus.
Meanwhile, most of the campus is deficient when it comes to car maintenance.  Only 22.5% of students could change the oil in their car.   
  • If you do need your oil changed and have no clue where to go, try asking random men: 1 out of every 3 men could do it, while only 1 out of every 10 women could.
Almost half of the campus starts preparing their papers at least a week in advance.  5.8% wait till the last day.

Movies are the most popular entertainment choice on campus, by dollar spent, with books close behind. 
  • Women are more likely to spend money on books or movies.  Men are more likely to spend money on music and computer/video games.  Men are also more likely to spend money on nothing at all.
  • I decided to investigate, and see if there were any trends that could be seen by looking at entertainment choices, and relationship status.  Here are a few interesting data points:
    • 60% of those who do not want to be in a relationship primarily spend their money on books.
    • 55% of those who are in a relationship primarily spend their money on movies.
    • People who want to be in a relationship are the most likely to buy music, while those who have made it into a relationship are the least likely to buy music.
7.4% of men say they have no problem asking a girl out immediately after meeting her.  48% might be ready to act after knowing a girl for a month, and 30% would prefer to wait for at least one semester.
  • Random factoid: we’re a little over a month into the semester.  50% of guys have no excuse.
For the female only question, I accidentally included a rather significant error that completely altered the meaning of one of the answers.  Unfortunately, this means that the data from that question is not usable.  Sorry, people...

Survey 3 Data:

Approve - 41.7% (43)
Don't Really Care - 41.7% (43)
Disapprove - 16.5% (17)


Mount Vernon, Montpelier, Monticello, Oak Hill, Red Hill - 9.7% (10)
D1, D2, D3, D4, D5 - 90.3% (93)


I never plan to be in a relationship - 1.0% (1)
I'd rather not be in a relationship at this time - 16.5% (17)
Right now, I have no preference either way - 16.5% (17)
I'd like to be in a relationship, provided it's the right person - 42.7% (44)
I am in a relationship - 23.3% (24)


Left - 36% (36)
Right - 64% (64)


Yes - 22.5% (23)
No - 77.5% (79)


At least three weeks - 11.7% (12)
From 1 to 2 weeks - 35.9% (37)
Between 2 and 6 days - 46.6% (48)
24 hours or less - 5.8% (6)


Computer/Video Games - 7.8% (8)
Music - 18.4% (19)
Movies - 35.9% (37)
Books - 29.1% (30)
None of the above - 8.7% (9)
 

It only takes a moment - 7.4% (4)
A week, minimum - 3.7% (2)
At least a month - 48.1% (26)
No less than a semester - 29.6% (16)
A year. Maybe two - 11.1% (6)


Demographic information:
Total Participants: 103
Male: 54
Female: 49
Freshmen: 11
Sophomores: 34
Juniors: 18
Seniors: 35
Alumnae: 5

Other interesting results:


Friday, September 14, 2012

Season 2: Episode 2 Results

Here we are again.  Another week, another insight into our campus.  Without further ado:

Highlights from the Survey:

We have a tall campus:
  • At 5' 11.0", our male population is 1.4 inches taller than the national average.
  • At 5' 6.3", the females beat the national average by 1.7 inches.
  • Yes, we're even above average when it comes to height!

The average (mean) number of siblings PHC students have is 3.031. The survey ranged from those who were only children to those with 10 siblings. The mode and median number of siblings is 3.
  • Gregory asked this question last year, and it appears that we've had a significant reduction in siblings since last year, when the average was 3.497. (See Survey 11, April 23, 2012)
  • While the freshmen tended to come from smaller families, there are not enough of them to explain the entire difference in numbers.  It's likely that a larger percentage of the class of 2012 came from larger families.
We like our freshmen.  We think think they're above average.  Welcome freshmen, you make our college look good.
  • Freshmen and Sophomores tend to have the highest opinion of the newcomers.  A possible reason for that is the seniors and juniors are in relationships, and each couple is spending so much time examining each others corneas that they haven't seen the new class.
About 60% of our campus considers themselves to be natural leaders.  It follows then that 40% of us don't.  We decided to look at this factor in-depth.  (For those who get confused by numbers, and/or can't follow every step, jump down to the end of the bullet points, and I'll give a nice concluding paragraph)
  • Men (71.4%) are more likely to consider themselves to be natural leaders than women are (54.0%).
  • There's an even more curious connection between height and inclination toward leadership.  Of those in the shortest bracket, only 37.5% considered themselves to be natural leaders, while in the tallest bracket, a whopping 79.2% did.  The trend holds true through the other, medium brackets as well.
  • That's when we got really curious.  Being tall or being male are both indications that you might consider yourself to be a leader, but which is more important?  We decided to look at the height/leader chart for each gender separately.
  • Males: For men, height does not seem to be an important variable.  In each height bracket, approximately the same ratio of men consider themselves to be natural leaders, though there is evidence of a slight increase with height.  Taller men are not much more likely to consider themselves to be leaders.
  • Females: For women, height seems to be a very important variable.  In the shortest bracket, 1/3 of females considered themselves to be leaders.  In the tallest female bracket, 2/3 of females considered themselves to be leaders.  If you're female and tall, you are twice as likely to consider yourself to be a natural leader, than if you were short.  (In fact, taller women are about as likely to consider themselves to be leaders as men are)
So, in conclusion: Men are more likely to consider themselves to be leaders, and it does not matter how tall they are.  Women are less likely to consider themselves to be leaders, and taller women are much more likely than shorter women. 

Our campus likes Doctor Who.  Well those parts of our campus that have seen it.  If you haven't seen it and are trying to decide, consider this: 70% of those students who have seen it gave it a positive rating!  That's better than flag football.

C.S. Lewis is our favorite writer.  He had almost 3 times as many votes as our second place contender: J.R.R. Tolkien.  See the full list of every author who received at least two votes below.

We tend to be a very logical, analytical campus.  Only about 15% of the students here are more spontaneous than analytical.  God bless those students: without you everyone else would go mad.

Survey 2 Data:

Shorter than 5' - 0%
5'-5'4" - 18.8% (24)
5'4"-5'8" - 27.3% (35)
5'8"-6' - 35.2% (45)
6'-6'4" - 18.8% (24)
Taller than 6'5" - 0%


0 - 6.3% (8)
1 - 21.1% (27)
2 - 20.3% (26)
3 - 25.8% (33)
4 - 7.8% (10)
5 - 3.9% (5)
6 - 5.5% (7)
7 - 2.3% (3)
8 - 2.3% (3)
9 - 1.6% (2)
10+ - 3.1% (4)

Poor: 0.8% (1)
Below Average: 7.1% (9)
Average: 52% (66)
Above Average: 38.6% (49)
Excellent: 1.6% (2)

Yes - 58.3% (74)
No - 41.7% (53)

Love - 14.1% (18)
Like - 20.3% (26)
Mild Dislike - 11.7% (15)
Hate - 3.1% (4)
Haven't Seen - 42.2% (54)
Want to See - 8.6% (11)

Yes - 3.2% (4)
No - 81.7% (103)
Unsure - 15.1% (19)

Yes - 42.2% (27)
No - 46.9% (30)
Unsure - 10.9% (7)

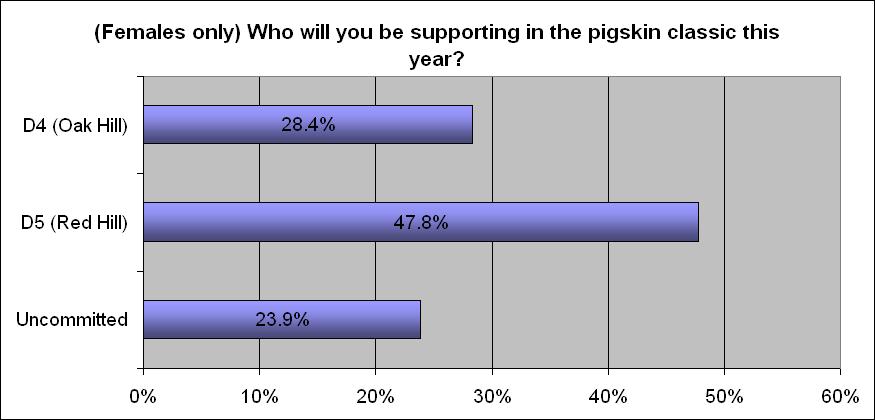
D4 - 28.4% (19)
D5 - 47.8% (32)
Uncommitted - 23.9% (16)

CS Lewis - 31
JRR Tolkien - 12
Charles Dickens - 9
Jane Austen - 4
GK Chesterton - 4
George Orwell - 3
Fyodor Dostoevsky - 3
Agatha Christie - 2
T.S. Elliot - 2
Ayn Rand - 2
Francine Rivers - 2
Ted Dekker - 2
Other - 36

1 - 4.7% (6)
2 - 18.9% (24)
3 - 26.0% (33)
4 - 23.6% (30)
5 - 11.0% (14)
6 - 6.3% (8)
7 - 4.7% (6)
8 - 3.9% (5)
9 - 0.8% (1)
10 - 0.0% (0)


Demographic Data:
Male: 63
Female: 64
Freshman: 13
Sophomore: 42
Junior: 24
Senior: 41
Allumni: 8
Total: 128


Other Results of Interest:


asd

Friday, September 7, 2012

Season 2: Episode 1 Results

We may be late, but, like the postal service, we always come through.  Unlike the postal service, we have no intention of raising our rates.  So here you go: enjoy the perfectly free results of the first survey of the semester.
 
Highlights from the survey:

Over 37% of the students would love to see Pres. Obama flummoxed by Dr. Mitchell’s perspicuity, though almost a fifth dispute that watching Dr. Guluizza talk him under the table would be more exciting.

Usage of the vending machines doesn’t vary much by gender.  If anything, males are four percentage points less likely to use them than females.

The south classroom is wildly approved of by almost a three-to-one margin.
  • Males are twice as likely to approve of the new South classroom as females.   
  • Females are three times as likely to disapprove as males
  • Favorite comment about the South Classroom: “As Dr. Favelo would say: Trippy. Veeeery trippy.”
Females are slightly more likely to disapprove of their intranet picture than males.  This can be particularly seen by examining the mode for each gender: men chose ‘7’ more often than any other option, and women chose ‘5’ more often.
  • Average approval level: 5.7
  • Average approval level for men: 5.8
  • Average approval level for women: 5.6
Men are exactly evenly split between the two computer types, but women prefer Macs.  Actually, women generally prefer to stay out of it entirely.  Linux continues to be the Ron Paul of computers.

The Freshman Dance is very popular, especially with freshmen, of whom over 60% are already planning on going.  The Juniors are the most undecided, with over 50% refusing to commit one way or another.  The seniors are the worst spoilsports, with almost a quarter refusing to go.

Survey 1 Data:

Dr. Mitchell - 43
Dr. Guliuzza - 22
Dr. Haynes - 14
Dr. Farris - 8
Prof. Russell - 7
Dr. Montgomery - 5
Dr. Spinney - 4


Multiple times a day - 0.8% (1)
Daily - 0.8 (1)
A couple times a week - 4.9% (6)
Once every week or two - 15.6% (19)
Once a month or less - 39.3% (48)
Never - 36.1% (44)
New Machines? - 2.5% (3)


Yes - 36.9% (45)
Probably - 18.9% (23)
Only if asked - 3.3% (4)
Undecided - 15.6% (19)
No - 21.3% (26)
Alas, no - 4.1% (5)


Approve - 28.7% (35)
Undecided - 35.2% (43)
Disapprove - 11.5% (14)
It's different? - 20.5% (25)
Other - 2.5% (3)


0-2 - 7.4% (9)
3-5 - 0.8% (1)
6-8 - 2.5% (3)
9-11 - 0% (0)
12-14 - 21.3% (26)
15-16 - 39.3% (48)
17-18 - 24.6% (30)
19+ - 2.5% (3)


0 - 16.4% (20)
1 - 18.0% (22)
2 - 27.0% (33)
3 - 12.3% (15)
4 - 10.7% (13)
5 - 4.9% (6)
6 - 1.6% (2)


Yes - 13.9% (17)
Maybe - 7.4% (9)
No - 77.9% (95)


1 - 1.6% (2)
2 - 4.1% (5)
3 - 5.7% (7)
4 - 11.5% (14)
5 - 21.3% (26)
6 - 18.0% (22)
7 - 23.8% (29)
8 - 7.4% (9)
9 - 6.6% (8)

PC - 27.0% (33)
Mac - 31.1% (38)
Linux - 4.1% (5)
Can't we just get along? - 36.9% (45)
It's like heaven - 23.0 (28)
It's awesome - 46.7 (57)
Neutral - 3.3% (4)
Mixed bag - 8.2% (10)
Barely Surviving - 2.5% (3)
No roommates - 7.4% (9)
Other - 5.7% (7)
 
Demographic Data:
Male: 69
Female: 53
Freshman: 11
Sophomore: 39
Junior: 27
Senior: 37
Allumni: 6
Total: 122

Other Results of Interest: