Highlights from the Survey:
We have a tall campus:
- At 5' 11.0", our male population is 1.4 inches taller than the national average.
- At 5' 6.3", the females beat the national average by 1.7 inches.
- Yes, we're even above average when it comes to height!
The average (mean) number of siblings PHC students have is 3.031. The survey ranged from those who were only children to those with 10 siblings. The mode and median number of siblings is 3.
- Gregory asked this question last year, and it appears that we've had a significant reduction in siblings since last year, when the average was 3.497. (See Survey 11, April 23, 2012)
- While the freshmen tended to come from smaller families, there are not enough of them to explain the entire difference in numbers. It's likely that a larger percentage of the class of 2012 came from larger families.
- Freshmen and Sophomores tend to have the highest opinion of the newcomers. A possible reason for that is the seniors and juniors are in relationships, and each couple is spending so much time examining each others corneas that they haven't seen the new class.
- Men (71.4%) are more likely to consider themselves to be natural leaders than women are (54.0%).
- There's an even more curious connection between height and inclination toward leadership. Of those in the shortest bracket, only 37.5% considered themselves to be natural leaders, while in the tallest bracket, a whopping 79.2% did. The trend holds true through the other, medium brackets as well.
- That's when we got really curious. Being tall or being male are both indications that you might consider yourself to be a leader, but which is more important? We decided to look at the height/leader chart for each gender separately.
- Males: For men, height does not seem to be an important variable. In each height bracket, approximately the same ratio of men consider themselves to be natural leaders, though there is evidence of a slight increase with height. Taller men are not much more likely to consider themselves to be leaders.
- Females: For women, height seems to be a very important variable. In the shortest bracket, 1/3 of females considered themselves to be leaders. In the tallest female bracket, 2/3 of females considered themselves to be leaders. If you're female and tall, you are twice as likely to consider yourself to be a natural leader, than if you were short. (In fact, taller women are about as likely to consider themselves to be leaders as men are)
Our campus likes Doctor Who. Well those parts of our campus that have seen it. If you haven't seen it and are trying to decide, consider this: 70% of those students who have seen it gave it a positive rating! That's better than flag football.
C.S. Lewis is our favorite writer. He had almost 3 times as many votes as our second place contender: J.R.R. Tolkien. See the full list of every author who received at least two votes below.
We tend to be a very logical, analytical campus. Only about 15% of the students here are more spontaneous than analytical. God bless those students: without you everyone else would go mad.
Survey 2 Data:
 |
| Shorter than 5' - 0% 5'-5'4" - 18.8% (24) 5'4"-5'8" - 27.3% (35) 5'8"-6' - 35.2% (45) 6'-6'4" - 18.8% (24) Taller than 6'5" - 0% |
 |
| 0 - 6.3% (8) 1 - 21.1% (27) 2 - 20.3% (26) 3 - 25.8% (33) 4 - 7.8% (10) 5 - 3.9% (5) 6 - 5.5% (7) 7 - 2.3% (3) 8 - 2.3% (3) 9 - 1.6% (2) 10+ - 3.1% (4) |
 |
| Poor: 0.8% (1) Below Average: 7.1% (9) Average: 52% (66) Above Average: 38.6% (49) Excellent: 1.6% (2) |
 |
| Yes - 58.3% (74) No - 41.7% (53) |
 |
| Love - 14.1% (18) Like - 20.3% (26) Mild Dislike - 11.7% (15) Hate - 3.1% (4) Haven't Seen - 42.2% (54) Want to See - 8.6% (11) |
 |
| Yes - 3.2% (4) No - 81.7% (103) Unsure - 15.1% (19) |
 |
| Yes - 42.2% (27) No - 46.9% (30) Unsure - 10.9% (7) |
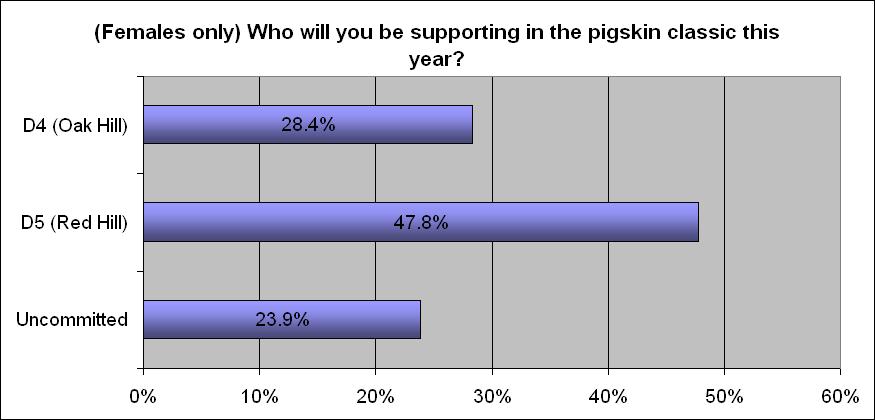 |
| D4 - 28.4% (19) D5 - 47.8% (32) Uncommitted - 23.9% (16) |
 |
| CS Lewis - 31 JRR Tolkien - 12 Charles Dickens - 9 Jane Austen - 4 GK Chesterton - 4 George Orwell - 3 Fyodor Dostoevsky - 3 Agatha Christie - 2 T.S. Elliot - 2 Ayn Rand - 2 Francine Rivers - 2 Ted Dekker - 2 Other - 36 |
 | |
| 1 - 4.7% (6) 2 - 18.9% (24) 3 - 26.0% (33) 4 - 23.6% (30) 5 - 11.0% (14) 6 - 6.3% (8) 7 - 4.7% (6) 8 - 3.9% (5) 9 - 0.8% (1) 10 - 0.0% (0) |
Demographic Data:
Male: 63
Female: 64
Freshman: 13
Sophomore: 42
Junior: 24
Senior: 41
Allumni: 8
Total: 128
Other Results of Interest:


No comments:
Post a Comment