(For the first nine questions, see Part I of the Survey 10 Results)
Conclusions
There is way too much data for me to cover adequately. Here are just a few things I personally thought were interesting. Feel free to post your own conclusions in the comments section :)
- Women are significantly more likely to care about church denomination than guys. Men, on the other hand, seem to be more willing to marry a woman with a different denominational background
- I wonder if this is because women feel safer about men being the spiritual heads of households if they know their husband is leading within the parameters of a denomination the woman is already comfortable with.
- Whether to have kids seems to be, by far, the most ubiquitous "top five factor" in the survey.
- Someone pointed out in the comments that the question could be interpreted either as "I want to marry someone who wants to have kids" or as "Whether someone wants to have kids is a big factor for me" (implying that the respondent might not want to have kids and is considering a spouse that would like to). I personally meant the former when I wrote the question, but it would definitely be an interesting study to see what y'all read the question as.
- Men are more than twice as likely as women to make "homeschooling" a significant factor.
- I wonder whether this is because men are more likely to want to homeschool their kids, or because men are more worried that a particular woman would be unwilling to stay home and homeschool.
- Women may be wanting to homeschool just as much as men, but don't see their husband objecting to it, so it counts as a less significant factor. On the other hand, it may be that women are just less likely than men to want to homeschool in the first place.
- For some reason, the Junior class doesn't care about politics at all. Shared political beliefs scored as less important as having "opposite personality" for the Juniors. This seems like a huge anomaly compared to the rest of the survey results. I wonder if this is just a statistical outlier or if the Junior class generally places less importance on political beliefs.
- It seems like "caring about health" goes up in importance through the years with Freshmen caring about it the least and Seniors caring about it the most.
- Every single demographic rated "similar interest in leisure activities" higher than "similar vocational goals" which seems to indicate that more students value compatibility in relaxing with a spouse rather than compatibility in working with a spouse. This may be implying too much from the actual survey wording, but it is a fascinating question. (To me anyway) :)
Survey 10 Results - Part II
Demographic Information (for Reference)
Total Participants in Survey: 160
Participants in Demographic data: 99% (159)
- Male: 57% (90)
- Female: 43% (69)
- Freshman: 32% (51)
- Sophomore: 21% (33)
- Junior: 27% (43)
- Senior: 16% (26)
- Alumnus: 4% (6)
Question:
Assuming he/she is a Christian, which of these things are
the most important to you in a future spouse?
Respondents could choose up to five from the following list:
- They agree with me on the Calvinist/Arminian debate
- They agree with me on the spiritual gifts
- They are in the same church denomination (or a very similar denomination)
- They agree with me on complementarianism/egalitarianism
- They want to have kids
- They want to homeschool
- We share a lot of the same interests in leisure (music/movies/activities)
- We share the same vocational goals (i.e. missions/politics/media/etc.)
- We have similar personality
- We have opposite personality
- They agree very closely with my political beliefs
- They care about health as much as I do
- They want to live in an area I want to live in
- I like their family
- I like their friends
- **None of these things are important to me**
How to interpret the graphs: Graphs are presented by question and broken down by demographic. The percentage indicates how many of that demographic chose that factor as one of their top five. So, for "I like their family," the statistic 42.3% for Seniors means that 42.3% of Seniors chose that option as one of their top five.
Graphs:
 |
Senior – 26.9% (7)
Junior – 20.9% (9)
Sophomore – 36.4% (12)
Freshman – 25.5% (13)
Female – 26.1% (18)
Male – 28.9% (26)
Overall – 27.5% (44)
|
 |
Senior – 11.5% (3)
Junior – 9.3% (4)
Sophomore – 3.0% (1)
Freshman – 15.7% (8)
Female – 11.6% (8)
Male – 11.1% (10)
Overall – 11.3% (18)
|
 |
Senior – 23.1% (6)
Junior – 30.2% (13)
Sophomore – 30.3% (10)
Freshman – 37.3% (19)
Female – 40.6% (28)
Male – 25.6% (23)
Overall – 32.5% (52)
|
 |
Senior – 61.5% (16)
Junior – 53.5% (23)
Sophomore – 54.5% (18)
Freshman – 45.1% (23)
Female – 50.7% (35)
Male – 53.3% (48)
Overall – 51.9% (83)
|
 |
Senior – 76.9% (20)
Junior – 67.4% (29)
Sophomore – 66.7% (22)
Freshman – 72.5% (37)
Female – 71.0% (49)
Male – 70.0% (63)
Overall – 70.0% (112)
|
 |
Senior – 42.3% (11)
Junior – 37.2% (16)
Sophomore – 15.2% (5)
Freshman – 35.3% (18)
Female – 20.3% (14)
Male – 44.4% (40)
Overall – 33.8% (54)
|
 |
Senior – 50.0% (13)
Junior – 53.5% (23)
Sophomore – 36.4% (12)
Freshman – 47.1% (24)
Female – 46.4% (32)
Male – 47.8% (43)
Overall – 47.5% (76)
|
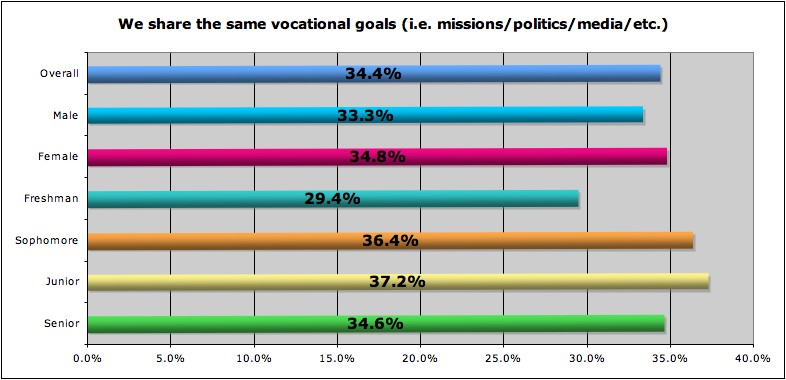 |
Senior – 34.6% (9)
Junior – 37.2% (16)
Sophomore – 36.4% (12)
Freshman – 29.4% (15)
Female – 34.8% (24)
Male – 33.3% (30)
Overall – 34.4% (55)
|
 |
Senior – 19.2% (5)
Junior – 30.2% (13)
Sophomore – 30.3% (10)
Freshman – 23.5% (12)
Female – 29.0% (20)
Male – 23.3% (21)
Overall – 25.6% (41)
|
 |
Senior – 7.7% (2)
Junior – 7.0% (3)
Sophomore – 3.0% (1)
Freshman – 7.8% (4)
Female – 8.7% (6)
Male – 4.4% (4)
Overall – 6.3% (10)
|
 |
Senior – 34.6% (9)
Junior – 4.7% (2)
Sophomore – 18.2% (6)
Freshman – 33.3% (17)
Female – 23.2% (16)
Male – 23.3% (21)
Overall – 23.1% (37)
|
 |
Senior – 19.2% (5)
Junior – 16.3% (7)
Sophomore – 9.1% (3)
Freshman – 2.0% (1)
Female – 8.7% (6)
Male – 12.2% (11)
Overall – 11.3% (18)
|
 |
Senior – 15.4% (4)
Junior – 14.0% (6)
Sophomore – 21.2% (7)
Freshman – 21.6% (11)
Female – 15.9% (11)
Male – 18.9% (17)
Overall – 17.5% (28)
|
 |
Senior – 42.3% (11)
Junior – 27.9% (12)
Sophomore – 42.4% (14)
Freshman – 41.2% (21)
Female – 42.0% (29)
Male – 33.3% (30)
Overall – 37.5% (60)
|
 |
Senior – 7.7% (2)
Junior – 18.6% (8)
Sophomore – 21.2% (7)
Freshman – 13.7% (7)
Female – 18.8% (13)
Male – 12.2% (11)
Overall – 15.0% (24)
|
 |
Junior – 2.3% (1)
Sophomore – 6.1% (2)
Male – 3.3% (3)
Overall – 1.9% (3)
|
Top Answers by Demographic
This is the same data presented by demographic and organized in order of most important to least important (as measured by quantity of people who chose the factor in their top five). Top five in each category are highlighted in blue.
Overall Results:
- Kids – 70.0% (112)
- Complementarianism/Egalitarianism – 51.9% (83)
- Interests (leisure) – 47.5% (76)
- Their Family – 37.5% (60)
- Vocational goals – 34.4% (55)
- Homeschool – 33.8% (54)
- Church Denomination – 32.5% (52)
- Calvinism/Arminianism – 27.5% (44)
- Similar personality – 25.6% (41)
- Political Beliefs – 23.1% (37)
- Area to Live – 17.5% (28)
- Their Friends – 15.0% (24)
- Spiritual Gifts – 11.3% (18)
- Health – 11.3% (18)
- Opposite Personality – 6.3% (10)
Male
- Kids – 70.0% (63)
- Complementarianism/Egalitarianism – 53.3% (48)
- Interests (leisure) – 47.8% (43)
- Homeschool – 44.4% (40)
- Vocational goals – 33.3% (30)
- Their Family – 33.3% (30)
- Calvinism/Arminianism – 28.9% (26)
- Church Denomination – 25.6% (23)
- Similar personality – 23.3% (21)
- Political Beliefs – 23.3% (21)
- Area to Live – 18.9% (17)
- Health – 12.2% (11)
- Their Friends – 12.2% (11)
- Spiritual Gifts – 11.1% (10)
- Opposite Personality – 4.4% (4)
Female
- Kids – 71.0% (49)
- Complementarianism/Egalitarianism – 50.7% (35)
- Interests (leisure) – 46.4% (32)
- Their Family – 42.0% (29)
- Church Denomination – 40.6% (28)
- Vocational goals – 34.8% (24)
- Similar personality – 29.0% (20)
- Calvinism/Arminianism – 26.1% (18)
- Political Beliefs – 23.2% (16)
- Homeschool – 20.3% (14)
- Their Friends – 18.8% (13)
- Area to Live – 15.9% (11)
- Spiritual Gifts – 11.6% (8)
- Opposite Personality – 8.7% (6)
- Health – 8.7% (6)
Freshmen
- Kids – 72.5% (37)
- Interests (leisure) – 47.1% (24)
- Complementarianism/Egalitarianism – 45.1% (23)
- Their Family – 41.2% (21)
- Church Denomination – 37.3% (19)
- Homeschool – 35.3% (18)
- Political Beliefs – 33.3% (17)
- Vocational goals – 29.4% (15)
- Calvinism/Arminianism – 25.5% (13)
- Similar personality – 23.5% (12)
- Area to Live – 21.6% (11)
- Spiritual Gifts – 15.7% (8)
- Their Friends – 13.7% (7)
- Opposite Personality – 7.8% (4)
- Health – 2.0% (1)
Sophomore
- Kids – 66.7% (22)
- Complementarianism/Egalitarianism – 54.5% (18)
- Their Family – 42.4% (14)
- Calvinism/Arminianism – 36.4% (12)
- Interests (leisure) – 36.4% (12)
- Vocational goals – 36.4% (12)
- Church Denomination – 30.3% (10)
- Similar personality – 30.3% (10)
- Area to Live – 21.2% (7)
- Their Friends – 21.2% (7)
- Political Beliefs – 18.2% (6)
- Homeschool – 15.2% (5)
- Health – 9.1% (3)
- Spiritual Gifts – 3.0% (1)
- Opposite Personality – 3.0% (1)
Junior
- Kids – 67.4% (29)
- Complementarianism/Egalitarianism – 53.5% (23)
- Interests (leisure) – 53.5% (23)
- Homeschool – 37.2% (16)
- Vocational goals – 37.2% (16)
- Church Denomination – 30.2% (13)
- Similar personality – 30.2% (13)
- Their Family – 27.9% (12)
- Calvinism/Arminianism – 20.9% (9)
- Their Friends – 18.6% (8)
- Health – 16.3% (7)
- Area to Live – 14.0% (6)
- Spiritual Gifts – 9.3% (4)
- Opposite Personality – 7.0% (3)
- Political Beliefs – 4.7% (2)
Senior
- Kids – 76.9% (20)
- Complementarianism/Egalitarianism – 61.5% (16)
- Interests (leisure) – 50.0% (13)
- Homeschool – 42.3% (11)
- Their Family – 42.3% (11)
- Vocational goals – 34.6% (9)
- Political Beliefs – 34.6% (9)
- Calvinism/Arminianism – 26.9% (7)
- Church Denomination – 23.1% (6)
- Similar personality – 19.2% (5)
- Health – 19.2% (5)
- Area to Live – 15.4% (4)
- Spiritual Gifts – 11.5% (3)
- Opposite Personality – 7.7% (2)
- Their Friends – 7.7% (2)
No comments:
Post a Comment